By Rupert Williams
Requirement
DNV standard DNV-ST-0119, “Floating wind turbine structures” references standard DNVGL-OSE301 “Position mooring”. Chapter 2 Section 4 Point 14 “Tension measuring equipment” mentions the requirement to measure and log the mooring line tensions. It also mentions in the associated guidance note that in some cases the tensions can be calculated:
Other mooring system such as submerged turret systems (buoys docked in a cone in a ship’s hull) tension measuring may be carried out by calculations. This requires that the position of the anchors and anchor line lengths are known within acceptable tolerances, and the unit’s position is known and continuously monitored.
Solution
The RUP Excursion Monitoring System can meet this requirement with the addition of the Mooring Line Tension software module. RUP has experience of implementing this approach for FPSOs. Prior to adding this software module to the system a work package must be carried out to compute the Load Response Curves.
Each mooring line can be analysed, using a package such as OrcaFlex, to determine its tension for a range of offsets from floating structure’s neutral position. The result of the analysis is a set of curves, one for each mooring line. The mooring design may be sensitive to water depth caused by changes in ballast/draft and tide; in which case additional curves may be required. This analysis is referred to as the set of Load Response Curves.

This plot shows the simplified Load Response Curves for one mooring line. The two curves represent the load response for high and low tide. The mooring line load is computed using the offset from the neutral position in the direction of the mooring line and uses the water depth to interpolate between the curves.
The Mooring Line Tension software module is configured with the Load Response Curve information for each mooring line. The software module runs in the background along with the other RUP Excursion Monitoring System software. The calculations are computed at 1Hz with the output tensions written into the realtime database as standard SCADA tags which can be alarm monitored, displayed and logged.
Display Examples
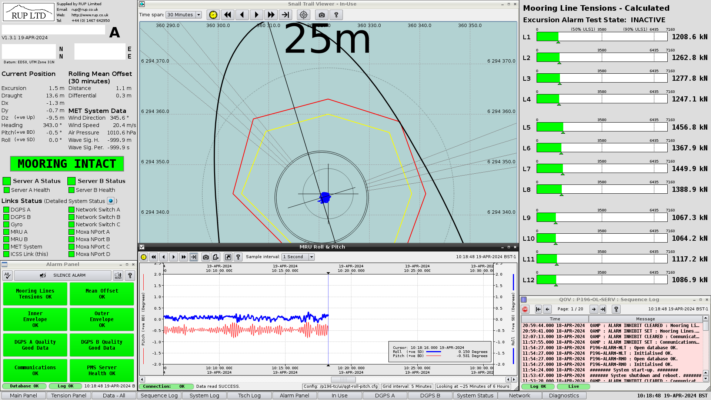
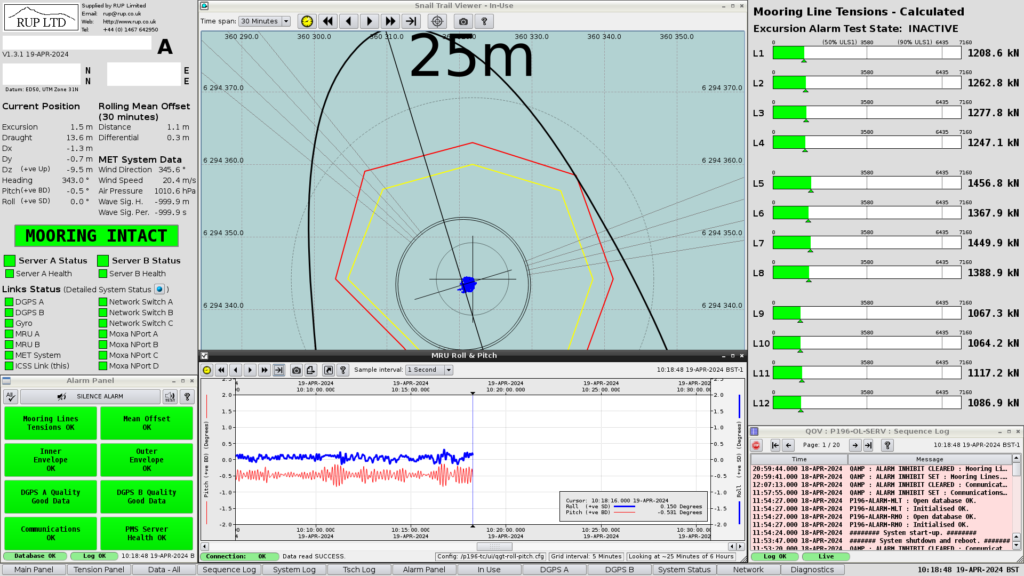
The display example shows a conventional representation of load bars, one for each mooring line. The bar will change from green to red when the alarm limits are exceeded.
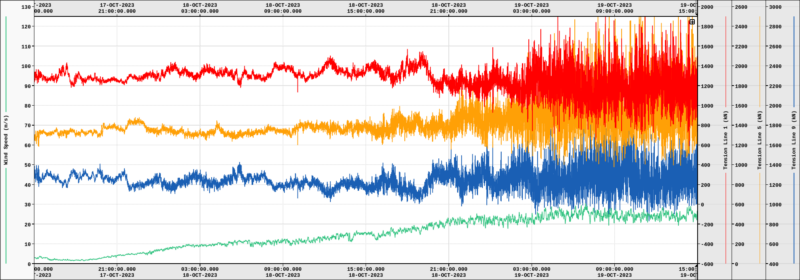
The graph shows real computed mooring line loads (red, orange, blue) and wind speed (green) over a period of 2 days. The scales for each mooring line are different so as to spread the trends on the graph. It is clear that there is a relationship between windspeed and mooring line loads.
What does failure look like?
Assuming a 3×2 mooring spread, the position offset caused by a single mooring line failure would result in large mooring line loads on the lines in the failed sector and their load bar displays would turn red. If the failure was sudden there would be a step change in the load trend. The failure would be announced by an audible and visual alarm in the Control Centre. Email alerts would also be sent if configured.
Conclusion
Incorporating mooring line tension monitoring is essential for ensuring the safety and reliability of floating structures. The RUP Excursion Monitoring System, equipped with our advanced Mooring Line Tension software module, offers a comprehensive solution for real-time tension calculation and monitoring. By leveraging Load Response Curves, this system provides precise and actionable data to prevent failures and enhance operational efficiency.
For more information on how our solutions can enhance your mooring systems, contact us today or request a demonstration. Let’s work together to ensure the safety and efficiency of your offshore operations.